

The impact of the Coronavirus pandemic on the digital advertising industry has been significant and constantly changing. We've gathered multiple industry data sources for an ongoing view of the COVID impact on the industry.
Online Ad Revenue Index - Ezoic
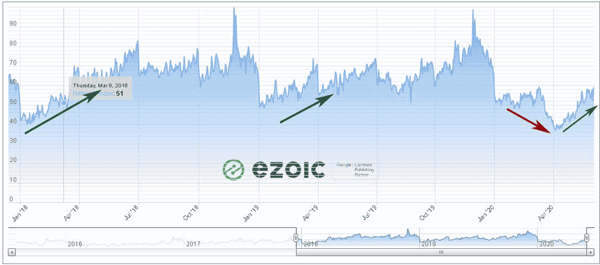
This real time customizable chart by Ezoic maps the relative online ad rates by day with an index of 100 being the highest date in recorded history.
Below is a snapshot taken 6-3-2020 showing data from Jan 2018 forward to illustrate the recent impact against the backdrop of the cyclical norms.
Google Search Spend Retail vs Travel - Merkle
From the Merkle Q1 2020 Digital Marketing Report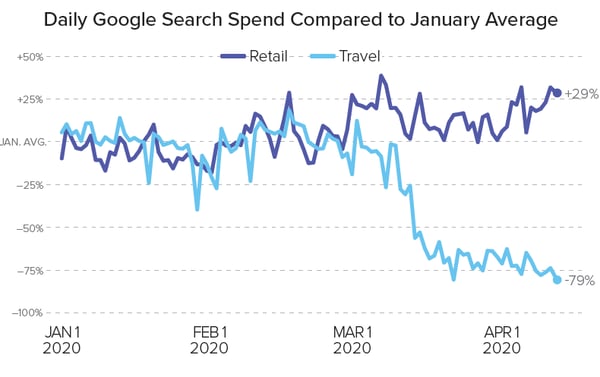
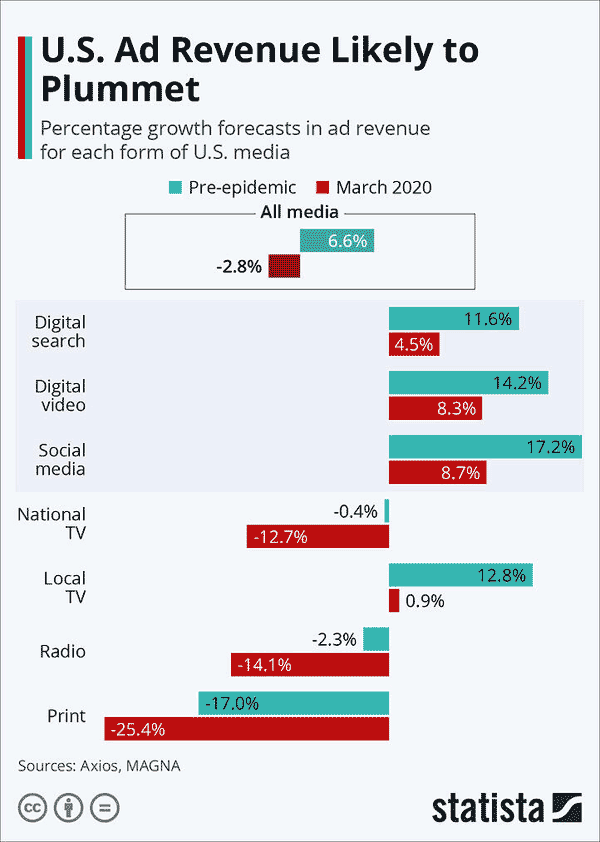
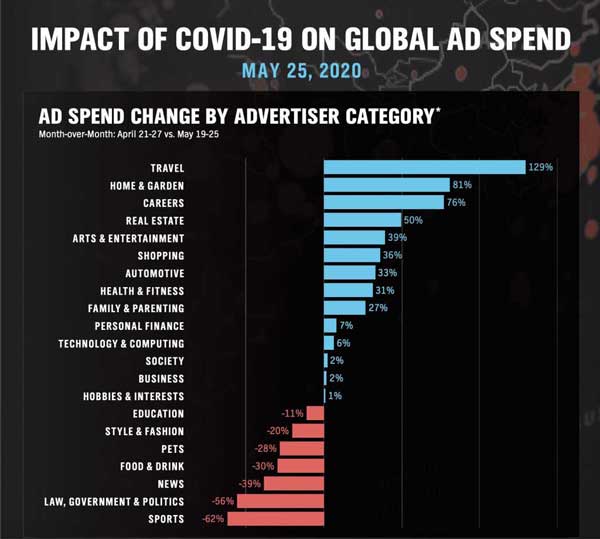
Significant Drop in Ad Revenue Forecasts – Statistica, with data from Axios, MAGNA
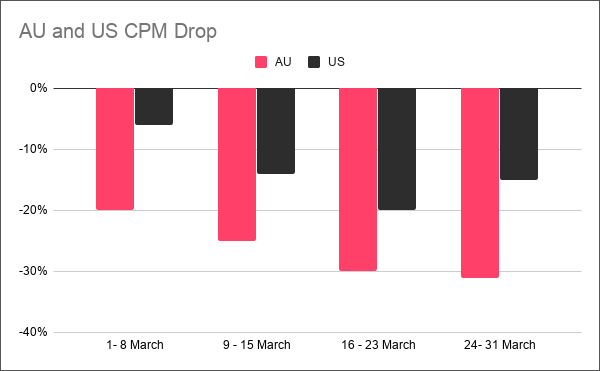
AU and US CPM Drop – Publift
Graph of year-on-year drop in CPM for Australia and US markets. Posted April 5th
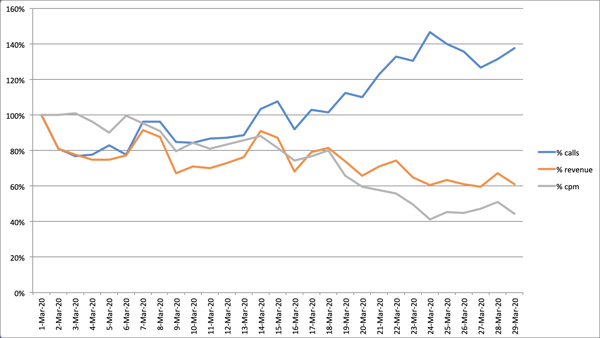
Video Ads Data in March - Playwire
Playwire video ad data from March show rising traffic, falling CPM and revenue as the Coronavirus impacts the economy.
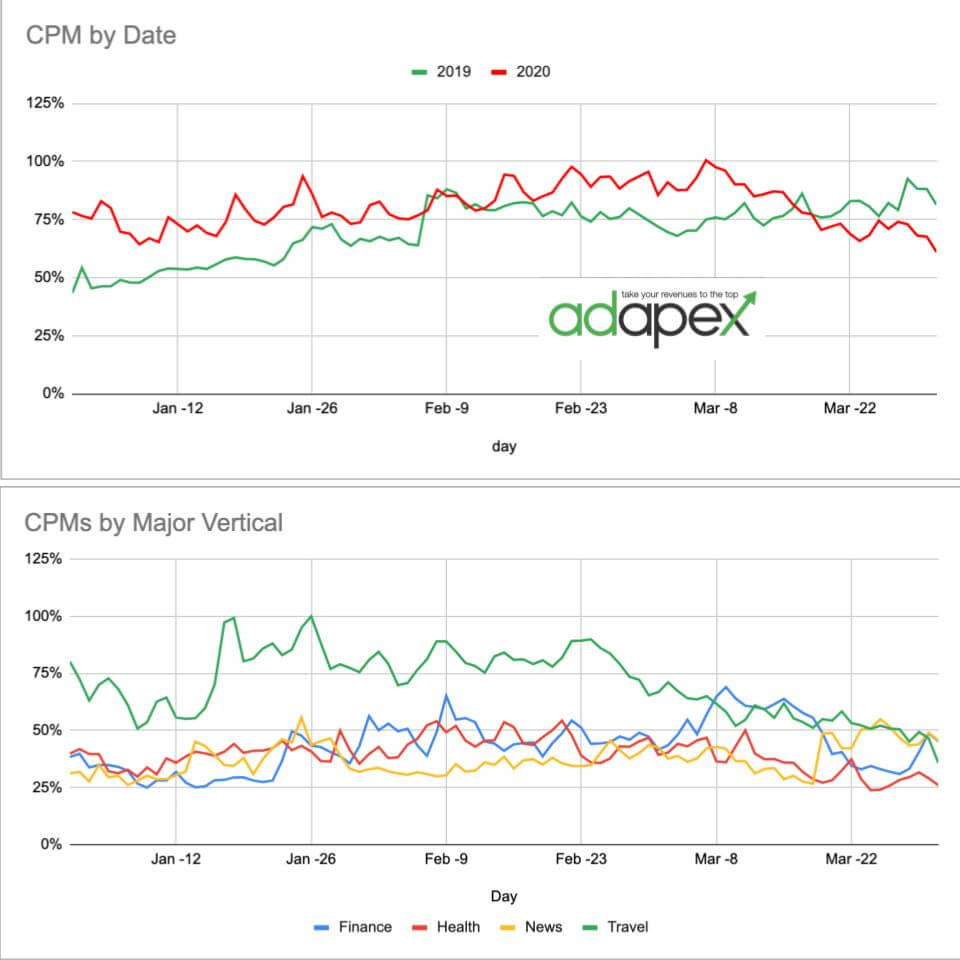
CPM by Date and Vertical through Q1 - Adapex
Adapex is tracking CPM through the pandemic, and notes significant drop towards the end of March, below 2019 levels, though Finance and News had some recovery.
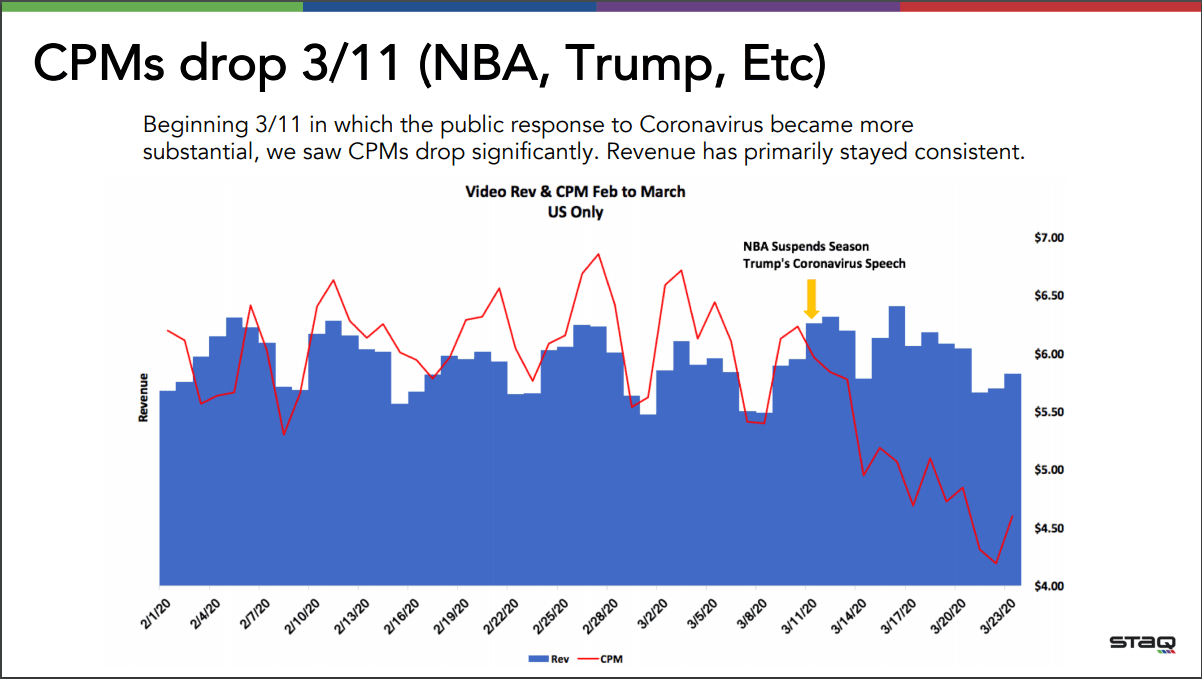
Video Ad CPM Drop in Response to Growing COVID Concerns – STAQ
Methodology and more data available in this STAQ Video Trends report from March 23.
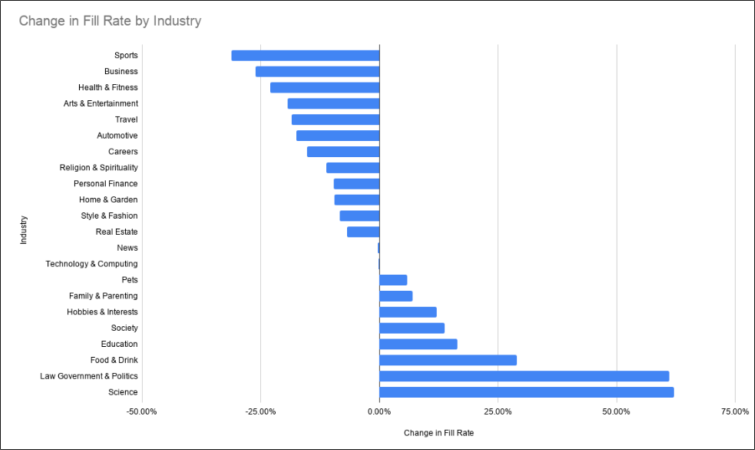
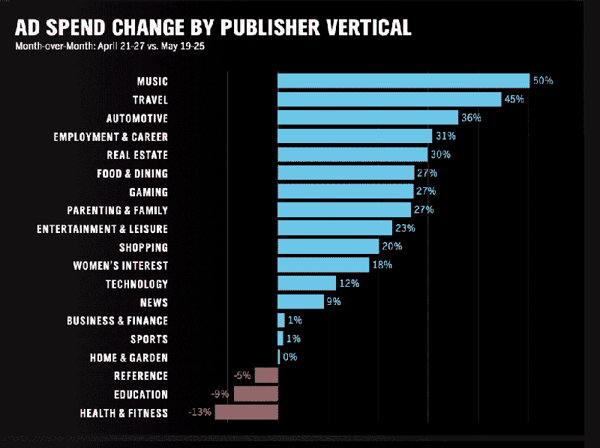
Fill Rate by Industry Shows Big Swings During Q1 – Sortable
This chart puts in stark contrast the impact across industries, with industries most affected by social distancing (sports, travel, etc) contracting. This Sortable post also compares 2019 v 2020 CPM for Q1, with a clear divergence for late March.
Travel Industry Impressions and CPM – FreeStar
Relative Daily CPM Values - Freestar Publishers
Insider reactions and impact estimates heard around the web
Here’s a link making the rounds in RevOp forums, though we cannot vouch for the accuracy of the information: Advertisers that are spending vs decreasing spend (according to industry insider assessments.) Sellercrowd facilitates media sales professionals sharing information about buyer behaviors in the market.
YouTube content creators seeing traffic go up, but CPM down and revenue drop by as much as 50% in march. – Digital Information World
More interviews and reactions regarding YouTube ad impact. Donut Media, Yoola, FBE - Tubefilter
Publishers Shifting Content Focus in Response to COVID – Strategies from BuzzFeed, DotDash, Group Nine, Leaf Group – AdExchanger
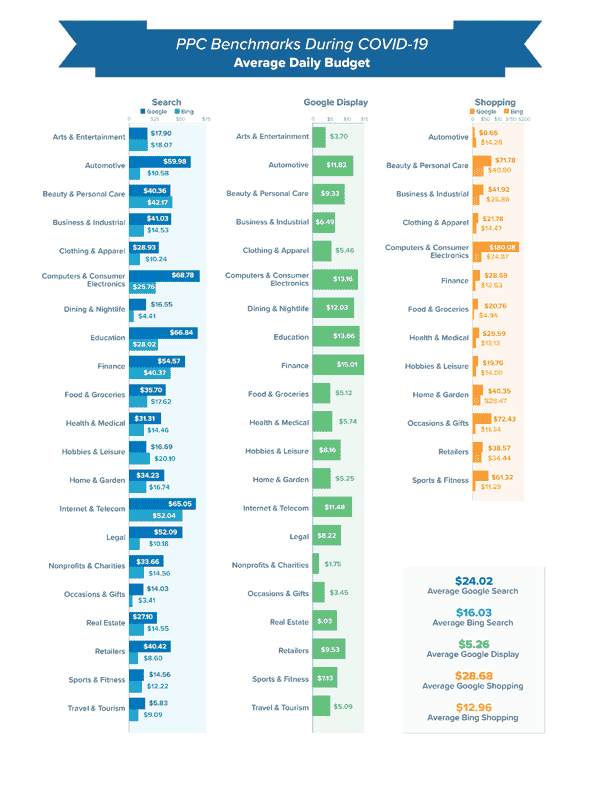
Benchmarks for PPC Search, Shopping, and Display Analyzed – Wordstream
Wordstream has produced several blog posts regarding PPC ad metrics by industry. The chart below lists daily budgets of 15,000 Wordstream customers between March 16 and March 31. More charts here, and here.
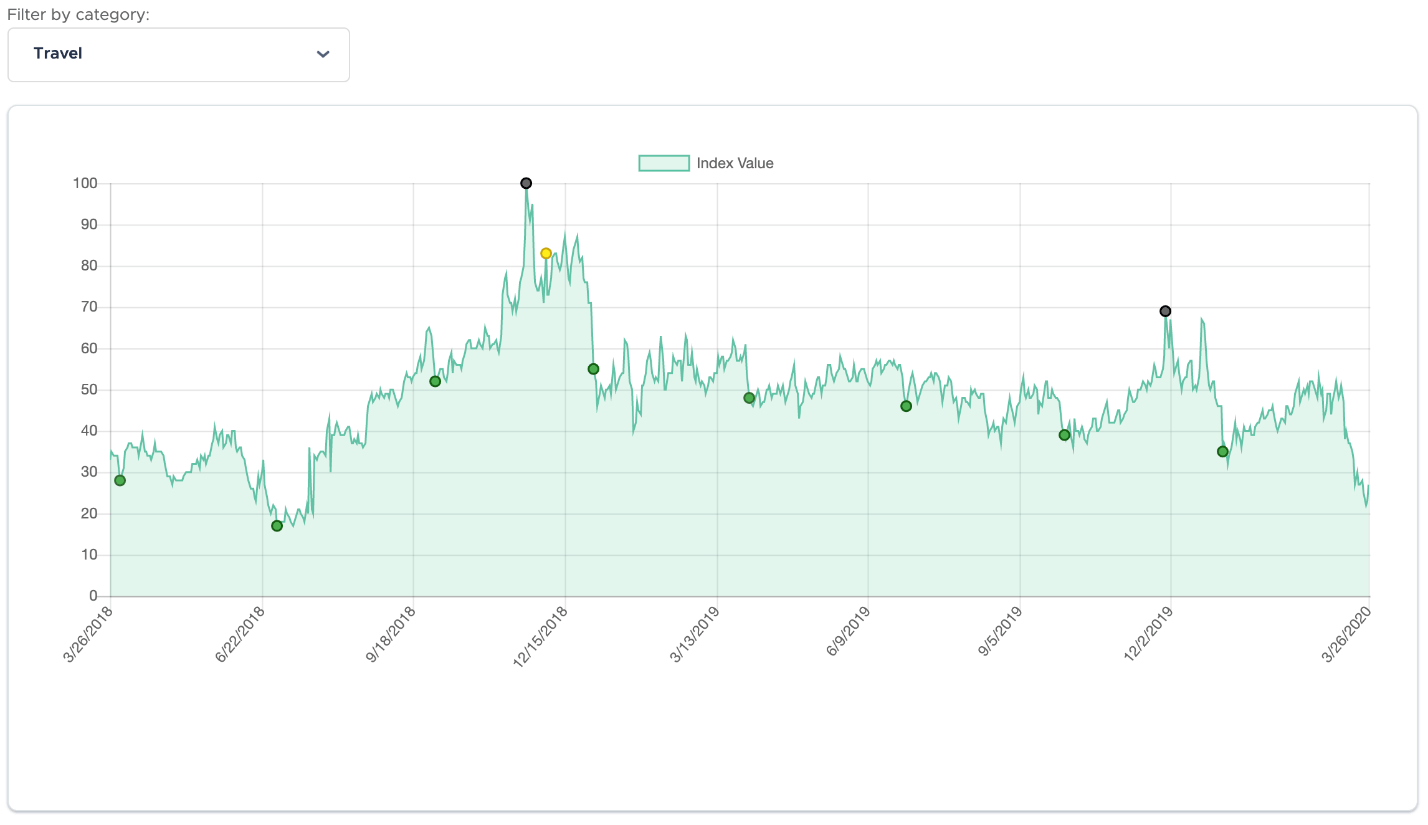
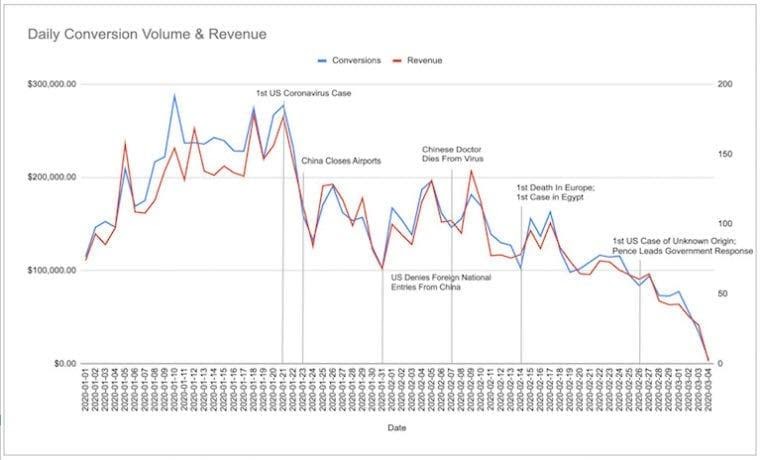
Online shopping patterns and search trends – PPChero
Sharp changes in buyer interest, searches, and product demand underscore some of the budget and rate changes in advertising. Below is an graph of falling Google search volume and revenue for a travel industry client of PPC Hero, annotated with key pandemic media messages.
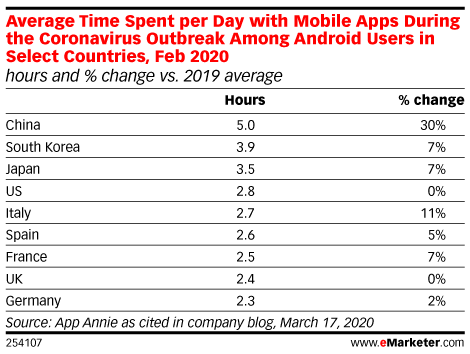
Mobile Use Spikes in Hotspots Under COVID Lockdowns – Emarketer
During February, mobile use jumped 30% in China as they dealt with peak lockdown response, and Italy began to rise as well.
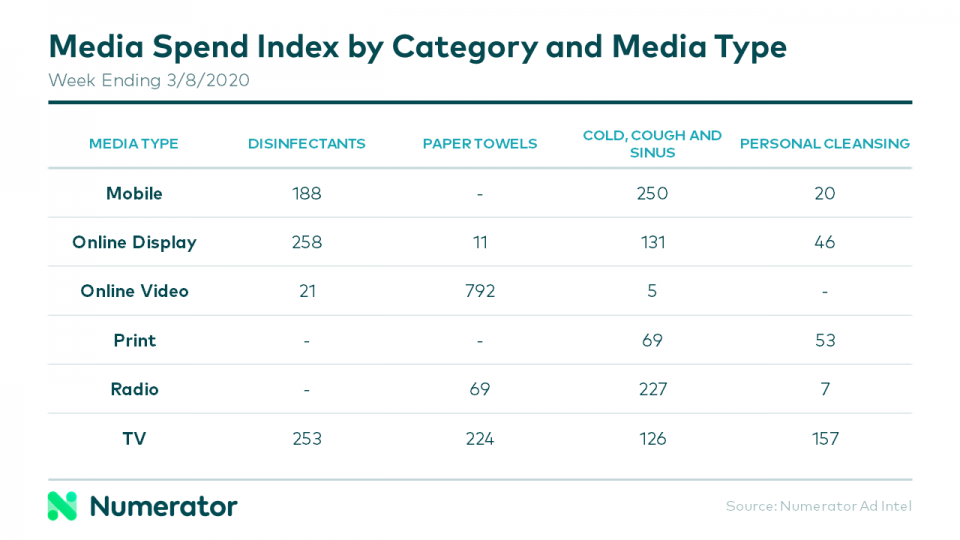
Media Spend Index by Category and Media Type – Numerator
Numerator focused in on March 8th, seeing heavy activity in pandemic-related categories as brands seek to distinguish their position in during heightened competition.
Interested in growing CPM revenues? Here are two more articles you might like:
Publishers interested in recovering adblock revenues, growing digital subscriptions, or building brand and longer term relationships with visitors, should contact Admiral for a demo of the Visitor Relationship Management platform.


