

Merkle has released it’s Q2 2020 Digital Marketing Report (DMR) , showing advertising trends, charts, and insights for online publishers who generate revenues through online ads. The report digs deep into organic search and paid search content promotion as well as the ongoing impact of COVID-19. Understanding advertising trends like these help publishers improve current revenue generation strategies, as well as planning for diversification and new products.
The full report is available here, and includes over 40 charts and graphs on ads, platforms, and industry trends.
General Trends
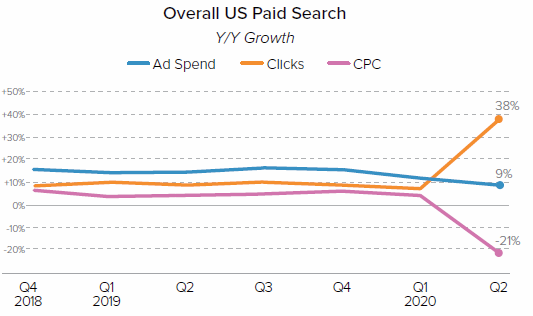
- Google search ad clicks jumped 39% in Q2 over Q1, while cost per click (CPC) fell 22%.
- Google search spend rose 9% Y/Y in Q2. Most large brands continued to buy ads across channels through Q2, benefiting the most during this time of uncertainty.
- Spending on Facebook and Instagram was up 4% in Q2 2020. Impressions were higher, but CPM’s fell 17%.
- Essential retailers saw a 70% Y/Y increase in Google search visits.
Organic Search Trends
Branded Google search visits rose sharply (33%) Q2 over Q2 2019, more than making up for the steep decline in Q1.
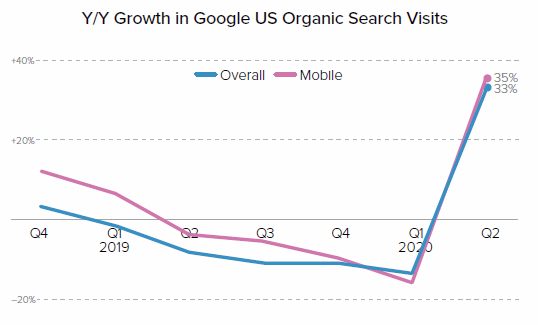
During Q2, when search ad spending dropped because of Coronavirus belt-tightening, people resumed visiting the branded sites. Mobile search followed the same general trend.
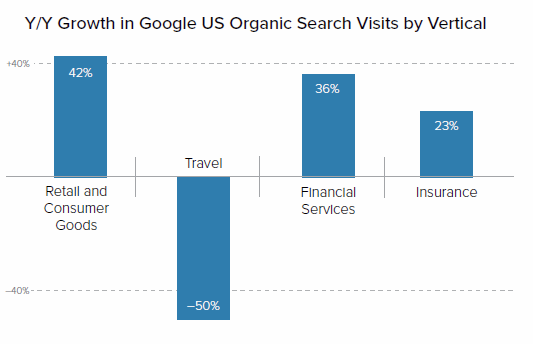
Organic searches surged by 43% Y/Y for retail and consumer goods brands. Financial Service brands were up 36%, but travel brands search fell 50%.
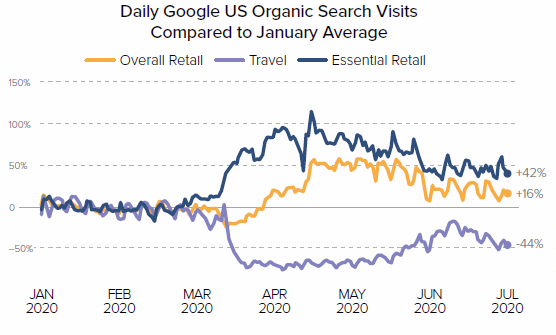
Organic search for "essential items" (toilet paper, sanitizer, etc.) spiked wildly (+100%) in April while non-essential retail dropped slightly, and travel inquiries took a free-fall (50%). By the end of Q2,
- Essential items searches were still 42% higher
- Overall retail had not only recovered. It rose 16% over March
- Travel brands have recovered slightly.
Search Ads
Search ads followed the overall trend. Google noted a steady climb in search spend in March to May even as CPCs came down, but the May peak was still well below pre-COVID spending. And by June the spending had dropped again.
Spending on search ads grew for both Google and Microsoft platforms, with clicks rising, and CPC’s lower:
- Spending growth on Google search ads: Q1 11%, Q2 9%; Google search ad clicks rose 39% Y/Y in Q2 2020.
- Spending growth on Microsoft search ads: Q1 18%, Q2 12%. Click growth increased 28% Y/Y in Q2 2020.
Retail, consumer goods,and financial services Google search ad clicks jumped over 40% Y/Y, while travel fell 47%. CPC’s were down sharply for most industries in Q2 2020.
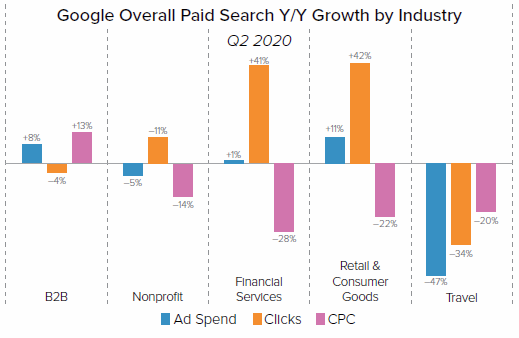
Interestingly, desktop ad clicks rose while mobile fell in April as more people worked from home, but they've since returned to normal.
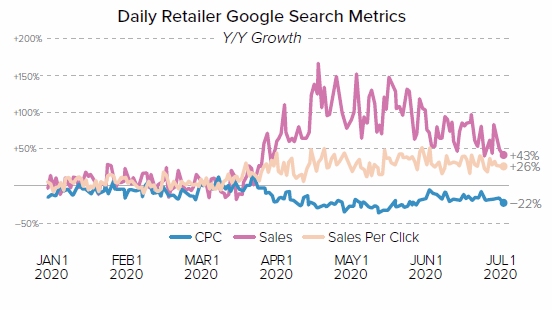
Daily retail sales from search ads grew a strong 87% Y/Y for Q2, with essential item retailers outperforming others.
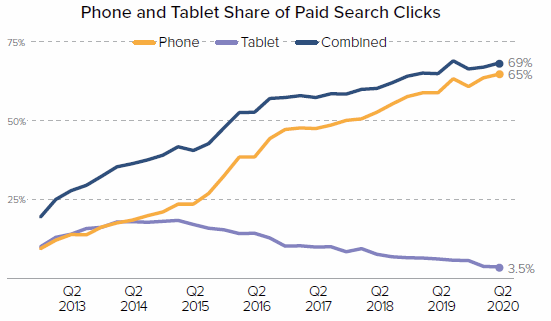
Phones account for two-thirds of all search ad clicks, a slight increase from Q1.
Social Ads
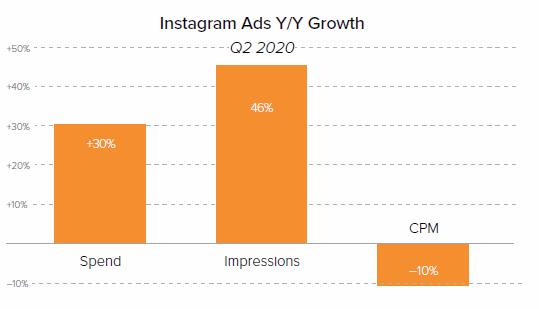
Instagram spending rose 30% over Q2 2019 among publishers who were already established there; the cost per 1000 impressions (CPM) dropped 10%. The largest growth was in:
- Retail
- eCommerce
- Financial services
Excluding IG, Facebook ad spending (including ads on their ad partner sites) slowed (+4%) in Q2 over Q2 the year before as the CPM dropped as well (-17%). At the same time, Facebook ad impressions rose 25%. Facebook's less than expected spending can be partially attributed to events in June when some large advertisers like Unilever temporarily pulled ads during a time of nationwide protests. However, by July it had mostly recovered.
Though not as widely adopted as Facebook/IG, Twitter, Snapchat, and Pinterest maintained share of ad spend of 10%, 8%, and 7% respectively in Q2 for brands running on those platforms.
 Download the full Merckle Digital Marketing Report Q2 2020 for more detail on ads and search, Amazon ads, local inventory ads (LIA), Google shopping, display ad spending, and more.
Ad Volatility Leads Publishers to Focus on Diversifying Revenues
The volatility in ad spend and CPM’s during the COVID-19 pandemic is just another pressure on publishers already challenged by new privacy regulation, adblocker adoption, a 3rd party cookie-less future, and even anti-competitive practices from tech giants. These are some of the factors that have led ad industry influencers to strongly encourage publishers to diversify revenue streams. Several reports have documented increased growth of digital subscriptions during the pandemic, for those with a publisher subscription solution in place.
The Admiral Visitor Relationship Management Platform helps publishers recover revenues lost to adblockers and grow a mutually beneficial partnership between publishers and audiences. Publishers could add ten new revenue streams with a single Admiral tag, with a consistent user experience. Grow email lists, social follows, paid subscriptions, and manage paywalls, site registration, or consent management.
Get your Admiral Revenue Analytics tag today, and have access to a dashboard geared to growing engagements with your audience, and building first-party relationships. Request a demo or your free account today.


